
The short answer
Prove it with your own before-and-after numbers, not industry claims. The value of an AI-ready design system comes mainly from less rework on agent-built UI (fewer off-system screens to fix), faster review (fewer design system comments per pull request), fewer accessibility and consistency defects reaching production, and prototypes that become production code with less rebuilding. Measure a baseline with the eval tasks and pull-request data you already have, make the changes, measure again, and convert the difference into hours with a simple model. Compare that with the cost: mostly people's time, plus tools. Present it as a range with your assumptions visible. A defensible, modest number persuades leadership more than a dramatic one.
- The first evidence is cheap: rerun three tasks before and after an AGENTS.md and a few lint rules.
- Separate what your work changed from what a new model version changed: run both against the same tasks.
- Part 20 of 20 in the series on AI-ready design systems.
The problem: "Why should we invest in this?"
Design system teams are good at explaining why AI-readiness matters to other designers and engineers. Leadership asks a different question: what does it cost, what do we get, and when? Answers like "agents will be 10× faster" or "everyone is doing it" don't survive a finance review. This article gives you a model you can defend, using numbers from your own teams. It builds on our general design system ROI model, which is worth reading first.
Where the value actually comes from
| Value | What changes | How to measure it | Strength of evidence |
|---|---|---|---|
| Less rework | Fewer agent-built screens need fixing for off-system components, tokens or variants | Eval pass rates; fix time per off-system task | Strong: directly measurable |
| Faster review | Fewer "use the system component" comments; less back-and-forth | Design-system-related review comments per PR; time to approve | Good: from PR data |
| Fewer defects | Fewer accessibility and consistency bugs reach QA or production | Bug counts tagged "a11y" or "design system", before and after | Good over a quarter or more |
| Prototype reuse | Prototypes built from real components need less rebuilding | Share of prototype code kept in production; rebuild time | Moderate: harder to attribute |
| Faster migration | Codemods and agents with clear rules move legacy code faster | Deprecated usage over time; engineer hours per migrated screen | Good, if tracked |
| Design system team leverage | Fewer repeated questions; gaps reported by agents arrive specific and early | Support questions per month; time to triage requests | Moderate |
Step 1: measure a baseline before changing anything
Every number in your business case depends on knowing where you started. Most of this data already exists.
Eval tasks
Run 10–15 real UI tasks with your teams' agent, several times each, and score them: lint and type pass, expected components used, raw values, deprecated imports (part 9). This gives you an off-system rate.
Fix time
For a handful of off-system results, time how long an engineer takes to bring them on-system. This gives you minutes per fix.
Volume
Estimate how many UI tasks per month are done with agents. Ask teams, or count pull requests labelled "ai-assisted" (part 18).
Review data
Sample 30 recent UI pull requests and count design-system-related review comments and review rounds.
Defects
Count accessibility and design consistency bugs from the last quarter.
Step 2: a simple model
Keep the model small enough to explain on one slide. The core is rework avoided:
rework hours saved per month =
    agent UI tasks per month
  × (off-system rate before − off-system rate after)
  × fix time per off-system task (hours)

review hours saved per month =
    UI pull requests per month
  × review minutes saved per PR ÷ 60

monthly value = (rework hours + review hours) × loaded hourly cost
payback (months) = one-time cost ÷ (monthly value − monthly running cost)
An illustration: Harbor's business case
| Input | Value | Source |
|---|---|---|
| Agent UI tasks per month | 400 | Team survey, checked against labelled PRs |
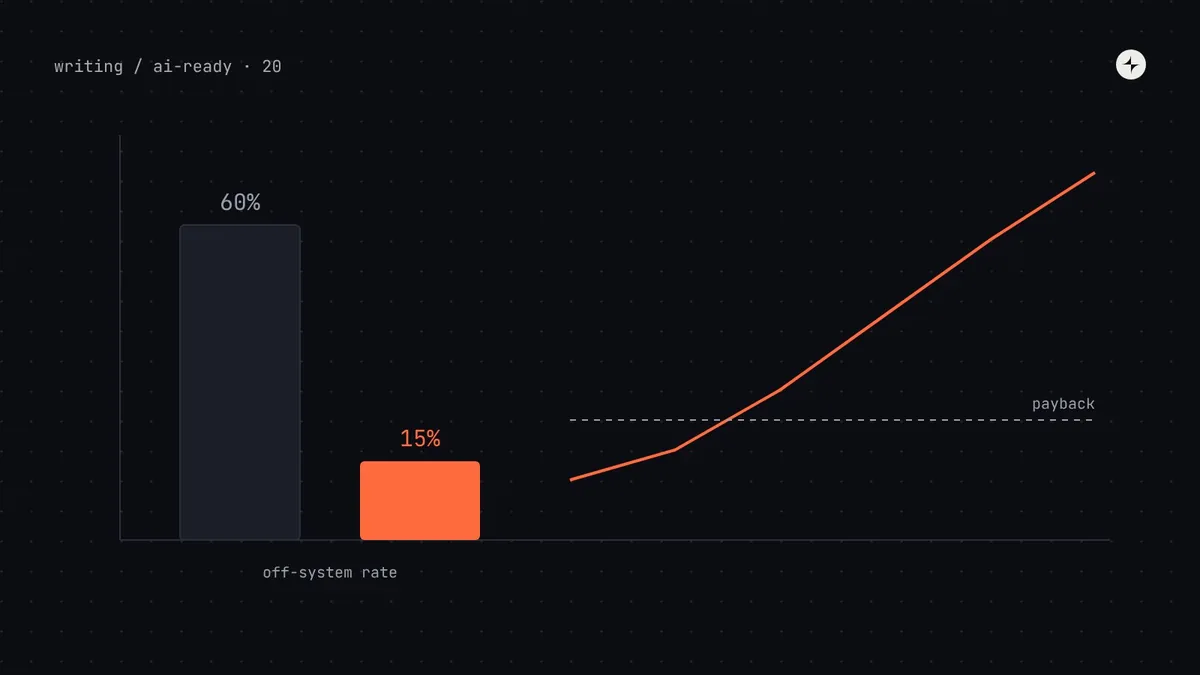
| Off-system rate before → after | 60% → 15% | Eval runs before the work and after phase 3 |
| Fix time per off-system task | 25 minutes | Timed on 12 samples |
| UI pull requests per month | 220 | Repository data |
| Review time saved per PR | 5 minutes | Fewer design system comments and rounds, sampled |
| Loaded hourly cost | $60 | Finance's figure |
| One-time cost | 12 person-weeks ≈ 480 hours ≈ $28,800 | Plan in part 10 |
| Running cost | 8 hours per month ≈ $480 | Upkeep of rules, metadata, evals |
Notice what's not in the model: defects avoided, prototype reuse, faster migration, the team's leverage. Leave them out of the headline number and list them as additional, unquantified benefits. That keeps the case conservative, which makes it more believable. If you'd like to model the wider design system alongside this, the ROI calculator in the Lab uses the same approach.
Step 3: present a range, not a point
Every input is an estimate. Show what happens if you're wrong.
| Scenario | Off-system rate after | Tasks per month | Monthly value | Payback |
|---|---|---|---|---|
| Cautious | 30% | 250 | ~$3,000 | ~12 months |
| Expected | 15% | 400 | ~$5,600 | ~6 months |
| Optimistic | 10% | 600 | ~$8,600 | ~4 months |
Step 4: attribute honestly
AI tools improve every few months. If results improve, leadership will reasonably ask how much came from your work and how much from a better model. Answer it before they ask:
- Run the same eval tasks with the old setup and the new model. The difference between "new model, old system" and "new model, new system" is your contribution.
- Change one thing at a time where you can, and record which change moved which number.
- Keep a held-out set of tasks you never tune against, so improvements aren't just teaching to the test.
- Report the parts that didn't improve. It makes the parts that did more believable.
Leading and lagging indicators
Some benefits take a quarter to show up. Give leadership something to watch in the meantime.
Shows the work is landing
- Eval pass rate
- Repos with the AGENTS.md section
- Semantic tokens with descriptions
- Components with metadata
- Deprecated imports per week
Shows the outcome
- Rework hours per month
- Review comments per UI pull request
- Accessibility and consistency defects
- Share of UI imports from the system
- Team survey: trust in agent output
More on choosing measures in design system metrics.
A one-page business case template
# Making Harbor AI-ready: business case

## The problem (with our numbers)
- 60% of agent-built UI tasks need fixing to match Harbor (eval, 15 tasks × 4 runs).
- Each fix takes about 25 minutes. About 400 tasks a month use agents.
- Design system comments appear in 1 in 3 UI pull requests.

## The proposal
Phases 0–3 of the plan (12 weeks, ~12 person-weeks): rules files, token
descriptions, component metadata, an MCP server, lint rules, monthly evals.

## Expected value (cautious / expected / optimistic)
~$3,000 / ~$5,600 / ~$8,600 per month. Payback in ~12 / ~6 / ~4 months.
Not counted: fewer accessibility defects, faster migration, prototype reuse.

## How we'll know
Eval pass rate monthly; review comments per UI PR quarterly; defects quarterly.
Checkpoint at week 6: if the eval pass rate hasn't improved, we stop and review.

## The ask
Two engineers at 50% and one designer at 40% for 12 weeks.The checkpoint line matters more than it looks. Offering a point where you'll stop if it isn't working makes the investment easier to approve, and the early phases (rules files, lint) usually show results by then.
Common mistakes
Quoting industry productivity claims
"Teams are 55% faster with AI" invites the question "which teams, measured how?". Use your own numbers.
Counting every benefit
A model with eight value streams looks inflated. Lead with two you can measure; list the rest.
No baseline
Without a before measurement, every improvement is an opinion. Measure first, even roughly.
Forgetting running costs
Rules, metadata and evals need upkeep. Include a monthly cost; it makes the payback honest.
The series in twenty lines
That's the end of the series. If you've read it in order, you've gone from what an AI-ready design system is to how to fund one. One line per part, to come back to:
| Part | The one thing to remember |
|---|---|
| 1 | Agents amplify whatever your system already is. |
| 2 | Agents copy what they find first; control what they find. |
| 3 | Describe every semantic token: use for, not for, use instead. |
| 4 | Types say what's allowed; metadata says what's right. |
| 5 | Every docs section must make sense on its own. |
| 6 | A short rules file in every repo is the cheapest big win. |
| 7 | A few task-shaped, read-only tools beat searching files. |
| 8 | Variables and Code Connect turn Figma into real components. |
| 9 | Lint messages are instructions agents follow. |
| 10 | One source of truth before many doors. |
| 11 | Diagnose from the transcript before fixing anything. |
| 12 | A short map every time; detail on demand. |
| 13 | Make accessibility a property of components, not prompts. |
| 14 | One side edited, the other generated, and a drift check. |
| 15 | Prototyping tools need your code and your guidelines. |
| 16 | Make your system readable before considering a rebuild. |
| 17 | Most agent mistakes are unwritten design decisions. |
| 18 | Whoever owns a decision for people owns it for agents. |
| 19 | Anything an agent reads is an input; review it. |
| 20 | Prove value with your own before-and-after numbers. |
The short version
- Value comes mainly from less rework and faster review; both are measurable within weeks.
- Measure a baseline first: eval pass rate, fix time, volume, review comments, defects.
- Use a small model: rework hours plus review hours, times hourly cost, against one-time and running costs.
- Present cautious, expected and optimistic cases, with sources for every input.
- Separate your work's effect from model improvements by running the same tasks both ways.
Back to the start: What is an AI-ready design system?, or see all twenty parts on the course page.
Frequently asked questions
What is the ROI of making a design system AI-ready?
It depends on your volume of agent-built UI and how often it needs fixing today. The main value is less rework and faster review. Measure your own off-system rate and fix time before and after, convert the difference into hours, and compare with the effort involved.
How do I measure the impact of AI on a design system?
Run a fixed set of real UI tasks with agents before and after changes and score them, track design-system-related review comments per pull request, and count accessibility and consistency defects over time.
How long does it take to see a return?
Early changes such as a rules file, token descriptions and lint rules usually show measurable improvement within weeks. Payback on a full programme depends on volume; modelling cautious, expected and optimistic cases gives a defensible range.
How do I separate our improvements from better AI models?
Run the same evaluation tasks with the new model against both the old and new setup. The difference between them is your contribution. Keep some tasks aside that you never tune against.
What should a business case for an AI-ready design system include?
The problem in your own numbers, the proposed work and cost, expected value as a range, the measures you'll track, a checkpoint where you'd stop if it isn't working, and the specific people and time you need.
Further reading
- Design system ROI: an honest modelThe general model this one builds on.
- Design system ROI calculatorRun the numbers with your own team sizes.
- Design system metricsChoosing measures at each stage.
- Guardrails for AI-generated UIThe eval method behind the baseline.