
The short answer
Design system ROI comes mostly from time saved on UI work, multiplied by how much of that work actually uses the system. A simple, defensible model: value = hours of UI work × adoption × speed-up × hourly cost, compared with the cost of the people who run the system. On those terms alone a system breaks even at roughly 22–23 engineers for every full-time system person, at 70% adoption and a 20% speed-up. Below that, the case rests on things the model doesn't count: rebrands, accessibility, dark mode, multiple products.
- Published speed-ups (34%, ~47%) are real but come from best-case tasks. Model with lower numbers.
- Adoption matters as much as component quality. A system nobody uses returns nothing.
- Fund it in stages, and let each stage earn the next.
Why most ROI claims fall over
"Design systems make teams 47% faster" sounds great in a slide deck and collapses under one good question: faster at what? That figure comes from a small study in which eight developers built a form from scratch, then with IBM's Carbon design system. Medians of 4.2 hours and 2 hours: about 47% faster. Documented It's a real result. It's also one form, eight people, and the from-scratch build always came first, so familiarity with the design helped the second.
Figma ran a similar internal experiment: designers with a relevant, up-to-date design system completed a task 34% faster. Documented Again real, again a best case, and run by a vendor with limited published detail.
Neither number tells you what your team will save across a year, because real work isn't all UI work, not all UI work uses the system, and adoption takes time. If your business case leans on 47%, it falls over at the first question from finance. Here's a model that doesn't.
What the evidence actually supports
Honest conclusion: design systems speed up the work they're used for, sometimes a lot. The size of the overall saving depends on how much work they're used for. That's the variable to model.
What a design system costs
The cost is almost entirely people. Count it in FTE-months (one person working full-time for one month) first, which works in any country, then convert to money with your own rates. The biggest cost drivers are the number of platforms (web, iOS, Android), the number of technologies in use, and the number of brands, not the number of components.
Startup
1 product, web, 2–3 designers, 8–15 engineers
- Design system designer0.5 × 3 mo
- Frontend engineer0.5 × 3 mo
6.6 FTE-months$40k–$132k at $6k–$20k a month per person
Mid-sized SaaS
2–3 products, web + mobile web, 6–12 designers, 40–80 engineers
- Design system lead (0.5)0.5 × 6 mo
- Design system designer1 × 6 mo
- Design system engineers2 × 6 mo
- Accessibility review0.2 × 6 mo
45 FTE-months$270k–$900k at $6k–$20k a month per person
Enterprise
5+ products, web + iOS + Android, multiple brands, 30+ designers, 200+ engineers
- Design system lead / PM1 × 12 mo
- Design system designers2 × 12 mo
- Web engineers3 × 12 mo
- iOS + Android engineers2 × 12 mo
- Accessibility specialist0.5 × 12 mo
- Docs / content0.5 × 12 mo
108 FTE-months$648k–$2,160k at $6k–$20k a month per person
The most expensive mistake is funding the build and not the run. A system with no team after launch decays: requests go unanswered, teams fork components, and the build investment is lost. Budget for running it from the start.
Where the savings come from
Time saved on UI work
Engineers and designers building screens from tested parts instead of from scratch, and spending less time on reviews, rework and "which grey is it?" questions.
Change made cheap
A rebrand, dark mode, a new market or an accessibility fix becomes a token change instead of a project. One such change can be worth more than a year of small savings.
Quality and risk
Fewer UI bugs, accessibility fixed at the source, lower compliance exposure, a product that feels like one product.
People
Faster onboarding for new designers and engineers, and a shared vocabulary that makes cross-team work smoother.
A simple ROI model, worked through
Here's the model from our playbook, applied to Ledgerly, a fictional SaaS company with 40 engineers and 6 designers. Illustration Every assumption is visible so you can replace it with your own.
| Assumption | Value | Why |
|---|---|---|
| Working hours per person per year | 1,600 | After holidays, meetings and leave |
| Share of engineering time spent on UI | 25% | The rest is back end, data, infrastructure, meetings |
| Share of design time spent on UI | 50% | The rest is research, strategy, workshops |
| Speed-up on work that uses the system | 20% | Deliberately well below the 34% and 47% best cases |
| Adoption | 40% → 70% → 85% | Share of UI work using the system, years 1–3 |
| Blended hourly cost | $90 | Replace with your own |
| System team | 2 FTE | At $12,000 a month each: $288,000 a year |
UI hours a year  = (40 engineers × 1,600 × 25%) + (6 designers × 1,600 × 50%) = 16,000 + 4,800 = 20,800
Hours saved, Y1  = 20,800 × 40% adoption × 20% speed-up = 1,664 hours
Value, Y1        = 1,664 × $90 = $149,760     // against a cost of $288,000
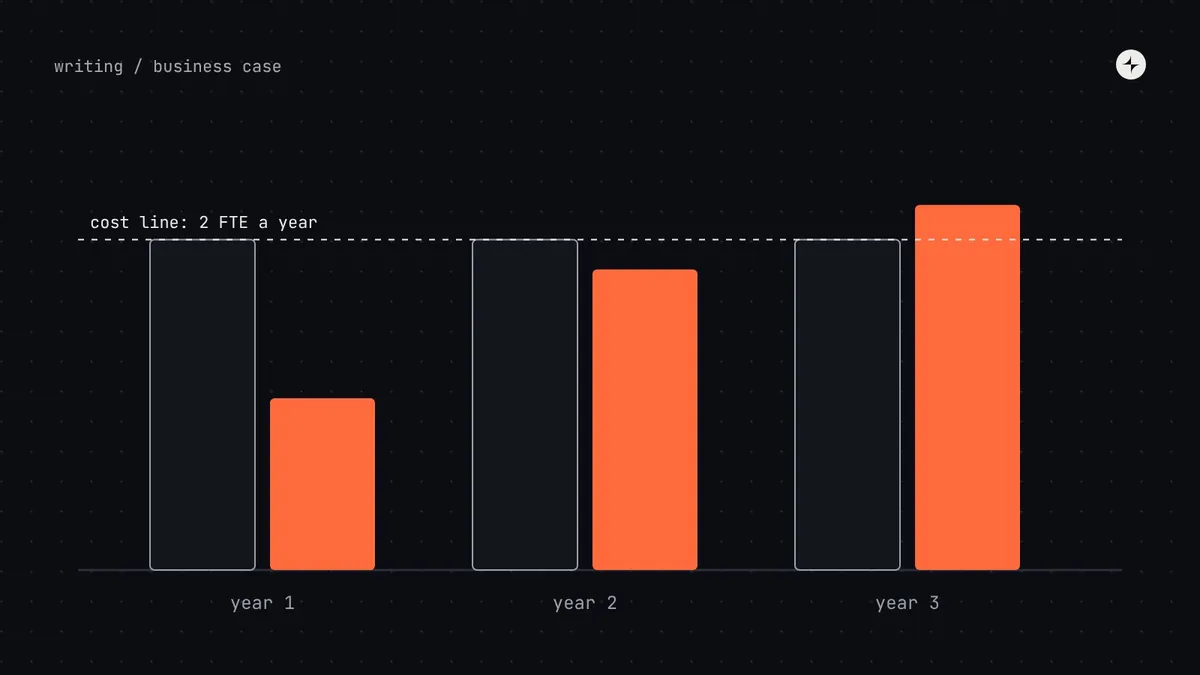
Year 140% adoption · 20% faster on system work
Net −$138,240
Year 270% adoption · 20% faster on system work
Net −$25,920
Year 385% adoption · 20% faster on system work
Net +$30,240
Two honest observations. First, on speed alone, the system loses money in years one and two and makes a modest return in year three (+$30,240, about 11%). Second, across all three years it hasn't yet paid back its cumulative cost. If Ledgerly's case rested on speed alone, it would be a weak case. It doesn't, because a rebrand or a dark mode that would otherwise take two quarters changes the picture entirely. But you should know which part of your case is which.
Break-even by team size
Flip the model around and ask: how many engineers does a system team need to serve before it pays for itself on speed alone?
| System team | Cost a year | Engineers needed to break even |
|---|---|---|
| 0.5 FTE | $72,000 | 12 |
| 1 FTE | $144,000 | 23 |
| 2 FTE | $288,000 | 45 |
| 4 FTE | $576,000 | 89 |
| 8 FTE | $1,152,000 | 178 |
| 2 FTE (34% speed-up) | $288,000 | 27 |
| 2 FTE (50% adoption) | $288,000 | 63 |
That gives a useful rule of thumb: roughly 22–23 engineers for every full-time system person, at 70% adoption and a 20% speed-up. A two-person team needs about 45 engineers using the system. A startup with eight engineers can't justify a dedicated team on speed, which is exactly why we recommend two part-time owners and an open-source library at that stage. See do you need a design system?
Sensitivity: what moves the answer
| Speed-up on system work | 40% adoption | 70% adoption | 90% adoption |
|---|---|---|---|
| 10% faster | −$213k | −$156k | −$119k |
| 20% faster | −$138k | −$25k | +$48k |
| 34% faster | −$33k | +$157k | +$284k |
Read across the rows and down the columns. Doubling the speed-up helps, but going from 40% to 90% adoption helps about as much. That's why adoption work (documentation, office hours, pilots, champions) isn't a nice-to-have. It's half the return. See how to measure adoption.
What the model doesn't capture
- Big changes: rebrands, dark mode, new brands or markets. Price the next one you know is coming with and without a system.
- Accessibility: issues fixed once in components instead of in every product, and lower legal and procurement risk.
- Quality: fewer UI bugs and less rework in review.
- Onboarding: new joiners productive sooner.
- Opportunity: what teams build with the time they no longer spend on buttons.
Don't put made-up numbers on these. Name them, give one real example from your own company, and let leadership weigh them alongside the speed model.
How to build your own business case
Baseline first
Run an audit: count button versions, hard-coded colours, accessibility issues, and time spent on a few recent UI tickets.
Model with conservative numbers
Use your own team sizes, UI share and costs, a speed-up of 10–20%, and a realistic adoption curve. Show the sensitivity table.
Add one big upcoming change
The rebrand, dark mode or new product that's already on the roadmap. Estimate it with and without tokens.
Ask for the smallest first step
Not a two-year programme. An audit, then foundations, then ten components, each with a gate.
Report against the baseline
Quarterly: adoption, one or two outcomes, and what's next.
Start small: funding in stages
Real outcomes are the best evidence. At CARS24, a token system made design-to-development handoff 65% faster across 10+ products, and a pattern library cut page design and build time by about 43%. See the token case study.
The short version
- Value = UI hours × adoption × speed-up × hourly cost. Cost = the people who build and run it.
- Use conservative speed-ups; the published 34% and 47% are best cases.
- On speed alone, break-even is about 22–23 engineers per full-time system person.
- Adoption moves the answer as much as quality does.
- The strongest cases add one big upcoming change, and fund the system in stages.
Frequently asked questions
How much does a design system cost?
Mostly people. Roughly 6–7 FTE-months in the first year for a startup, about 45 for a mid-sized SaaS company and 100+ for an enterprise with native apps and several brands. Multiply by your monthly cost per person.
How long until a design system pays for itself?
On speed alone, often two to three years, and only if adoption keeps rising. With a big change like a rebrand or dark mode on the roadmap, it can be much sooner.
Is a design system worth it for a small team?
A light one is: named tokens and a themed open-source library cost days and pay back on the first visual change. A dedicated team usually isn't, below about 20 engineers.
How do you present design system ROI to leadership?
Show the baseline, a conservative model with a sensitivity table, one concrete upcoming change priced with and without the system, and a small first step with a gate.
Where does the 47% figure come from?
A Sparkbox study in which eight developers built a form from scratch and then with IBM's Carbon: a median of 4.2 hours versus 2. It's real, but small and best-case.
Further reading
- Yes, Design Systems Do Improve Developer EfficiencySparkbox. The source of the ~47% figure.
- Measuring the value of design systemsFigma. The source of the 34% figure.
- A design system isn't a projectNathan Curtis. Why the run costs matter.
- Layer One pricingWhat an audit, a foundations build and ongoing partnership cost with us.