
The short answer
Measure a design system in three layers: adoption (is it used?), operations (does work flow: how fast requests are answered, how current the docs are?) and outcomes (is the product faster to build, more consistent, more accessible?). Don't count outputs like "components shipped" as success. Start with three or four metrics that fit your stage, take a baseline before you change anything, put them on a one-page dashboard and review it monthly.
- The core adoption metric is the share of UI built with the system, per product and team.
- Detach and override rates show where components don't meet real needs.
- A metric without a baseline can't show improvement.
Busy isn't the same as effective
An illustration: forty components shipped, adoption flat
A system team proudly reports 40 new components in a year, 26 releases and 12 workshops.
Adoption hasn't moved. Requests wait two months. Satisfaction has dropped. The team measured how much it did, not whether it helped.
The team starts tracking request turnaround, adoption by team and satisfaction. Within a quarter they find the real problem: slow triage and missing docs, not missing components.
Outputs, operations and outcomes
The metrics, area by area
Here's a full catalogue. Nobody needs all of them at once; the next section shows which to start with.
| Area | Metric | How to measure | Healthy direction |
|---|---|---|---|
| Adoption | Share of UI built with the system, per product and team | Code scan of imports vs local components | Rising |
| Products on a supported version | Package versions per product | Most within one major version | |
| Component usage | Uses per component; detach and override rates | Figma library analytics; code scan | Usage up, detaches down |
| Contribution | Contributions per quarter; number of different contributors | Tracker labels | Rising, from more teams |
| Requests | Time to first response; time to resolution; open requests by age | Tracker timestamps | Stable or falling; few old requests |
| Documentation | Searches with no results; pages past review date | Portal analytics | Falling |
| Support | Office hours attendance; questions answered within a day; share answered by peers | Sign-ups; channel analytics | Steady attendance; more peer answers |
| Satisfaction | "The system makes my work faster" (% agree) | Twice-yearly survey | Rising |
| Consistency | Hard-coded values; local copies of system components | Lint and code scans | Falling |
| Accessibility | Issues in system components and in products | Automated checks; audits | Falling |
| Efficiency | Time to build UI tickets with and without the system | Tracker data, sampled | System work faster |
Metrics by stage: what to measure when
Measuring has a cost. A small team tracking twenty metrics spends more time on spreadsheets than on the system. Start with a few and add more as the system and the team grow.
| Stage | Focus on | Why these |
|---|---|---|
| Startup | Hard-coded values (falling) · "Did we reuse or rebuild?" in reviews | Just enough to know the basics are sticking |
| Scale-up | Adoption per team · time to first response · satisfaction · hard-coded values | The system is new; adoption and responsiveness decide its future |
| Mid-sized | Add contribution · failed docs searches · office hours · version spread | Scale depends on contribution and self-service |
| Many business units | Add adoption per unit · extension health · request turnaround per unit | Fairness and reach across business units |
| Enterprise | A full dashboard, plus accessibility compliance and portfolio-level adoption | Leadership, compliance and many teams need evidence |
How to measure adoption
In code
Adoption happens in code, so start there. Scan each product's repository for imports from the system package and compare them with local components that do the same job. A simple script that counts, per product, how many UI component usages come from the system versus elsewhere gives you a percentage you can track monthly. Add version spread: how many products are on the current major version.
In design files
Figma's library analytics show how often each component is inserted and how often it's detached (unlinked so a designer can customise it). Detachments are gold: they show exactly where a component isn't meeting people's needs. Look for patterns, not individual cases.
In the product
For consistency, count what shouldn't be there: hard-coded colours and sizes, and local copies of system components. Lint rules can report these on every build, so the trend is free once it's set up. At JPMorgan Chase, checkers that compare Figma files and code against the system make this visible for 500+ designers and 1,000+ engineers. See the project.
Adoption can be gamed. A team that imports the system's button and overrides every style counts as "adopted". Pair adoption with override rates and hard-coded values to see real use.
A satisfaction survey that's worth running
Twice a year, ask everyone who uses the system a short set of questions. Keep it under five minutes so people finish it, and ask the same core questions every time so you can see trends:
"The design system makes my work faster." (strongly disagree → strongly agree)
The headline number. Track the share who agree.
"I can find what I need in the documentation."
Points directly at docs problems.
"When I ask the system team for help, I get a useful answer quickly."
Measures the operating model, not the components.
"In the last month, did you build something the system should have provided? What?"
Your next roadmap, in users' words.
"What's the one thing we should change?"
Open text. Read every answer.
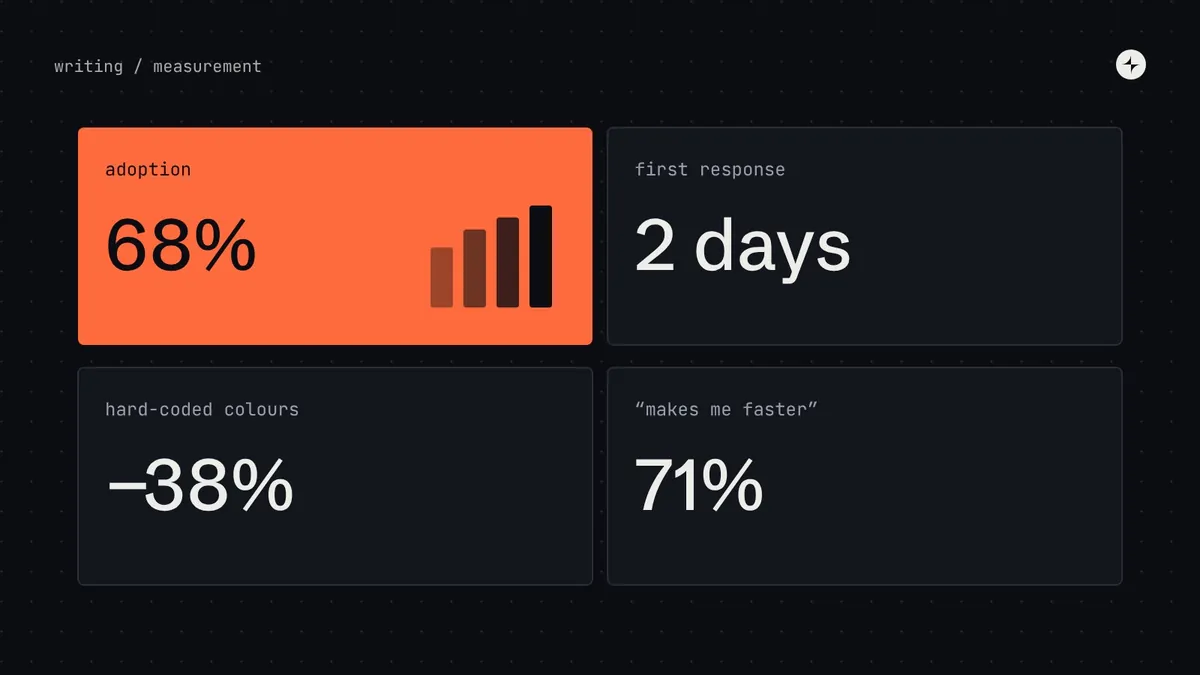
A one-page dashboard
Put the metrics you choose on one page, in four groups, and review it monthly. If it doesn't fit on one page, you're tracking too much. Every number shows its trend and, where something is weak, the action being taken.
Lowest: Reports (41%). Action: team visit.
6 contributions merged; median 3 days to merge.
2 open high-severity bugs.
41 office hours visits this month.
From metrics to improvements
Metrics are only useful if they change what you do. Each warning sign usually points to a specific part of the operating model:
| What you see | Likely cause | What to try |
|---|---|---|
| First-response time rising | Triage capacity, or triage meetings skipped | Protect weekly triage; add a support rota |
| High detach rate on one component | It doesn't cover a real use case | Interview the detachers; add a variant or a slot |
| Adoption flat in one product | Migration cost, or the team was never involved | Visit the team; pair on one screen; offer a migration guide |
| Failed docs searches rising | Missing pages, or different words for the same thing | Write the pages; add synonyms to search |
| Satisfaction falling | Usually responsiveness, not components | Read the open answers; fix the top complaint first |
Reporting to leadership
Leaders don't need the operational dashboard. Once a quarter, send one page: adoption trend, two or three outcomes in business terms (a launch that was faster, an accessibility issue fixed everywhere at once, a rebrand shipped in days), what's next, and what you need. If you want to put money on it, our design system ROI model shows how to turn adoption and time saved into a defensible number.
Case studies are outcomes in story form. At CARS24, the pattern library cut page design and build time by about 43%, and the token system made design-to-development handoff 65% faster. See how it was measured.
The short version
- Measure adoption, operations and outcomes, not outputs.
- Pick three or four metrics for your stage; baseline before you change anything.
- Measure adoption in code first; use detach rates to find where components fall short.
- Run a short satisfaction survey twice a year with the same core questions.
- One-page dashboard, reviewed monthly; one-page report to leadership, quarterly.
Frequently asked questions
What is a good design system adoption rate?
There's no universal benchmark, because it depends on how much legacy UI you have. What matters is the trend: new work should be mostly on the system within a year, and older screens should migrate steadily.
How do you measure adoption in code?
Scan each repository for imports from the system package and compare them with local components that do the same job. Track the share per product monthly, plus how many products are on the current major version.
What is a detach rate?
How often designers unlink a library component in Figma to customise it. A high rate on a component means it doesn't meet a real need.
How often should you survey design system users?
Twice a year is enough to see trends without survey fatigue. Keep it under five minutes and keep the core questions the same.
Which design system KPIs matter most to executives?
Adoption trend, time to ship, accessibility and consistency improvements, and the cost of big changes like rebrands. Express them in business terms, with a baseline.
Further reading
- Design That ScalesDan Mall. Includes his approach to measuring adoption.
- Measuring the value of design systemsFigma.
- Yes, design systems do improve developer efficiencySparkbox. How one efficiency study was run.
- Design Systems Report 2025zeroheight.