
The short answer
A design system audit (or interface inventory) is a structured look at everything your product's interface is made of: every button, input, message, colour, text style and spacing value, in design files and in code. You screenshot it, group near-duplicates, count the variations, check accessibility, and rank what to fix first. Done well, it takes about two weeks and ends in a ranked plan and a handful of "before" numbers leadership understands.
- Audit 15–25 key screens across every product and platform; you don't need every screen to see the pattern.
- Count in code as well as design. The code is where the real duplication lives.
- Run it with designers and engineers together. People who find the seven buttons themselves become the system's supporters.
What is a design system audit?
An audit answers one question: what do we actually have? Not what the style guide says, not what the Figma library contains, but what's live in production and in the code that builds it.
Brad Frost popularised the method as an interface inventory in 2013: screenshot every instance of every interface element, group them by type, and look at them side by side. The differences jump out immediately. We extend it in two directions that matter for planning a design system: counting what's in the code, and turning what you find into a ranked plan.
You need an audit when you're about to start a design system, when an existing one has lost trust, before a rebrand or dark mode, or when you need to make the case for investment. It's also the first thing we do in any engagement, because every later decision depends on it.
What you'll need
One or two designers and one engineer for most of two weeks, plus an hour each from product leads for the walkthrough. Ideally someone who can run accessibility checks.
Production (and staging) for every product and platform in scope, the main design files, and read access to the front-end repositories.
A shared board (FigJam, Miro or a Figma page), a spreadsheet for counts, a code search tool, and a browser accessibility checker.
The audit, step by step
Step 1: Pick your scope
Choose the 15–25 screens that matter most, by traffic, revenue or importance, across every product and platform: web, mobile web, iOS, Android, admin tools. Include at least one form-heavy flow, one data-heavy screen (a table or dashboard) and one empty or error state. These are where inconsistency hides.
Step 2: Capture everything, by category
Screenshot every instance of each kind of element and paste them onto one board per category. Categories that almost always reveal something:
Actions
Buttons, links, icon buttons, menus
Inputs
Text fields, selects, checkboxes, radios, toggles, date pickers
Feedback
Alerts, toasts, inline errors, empty states, loaders
Containers
Cards, dialogs, drawers, tabs, accordions
Data
Tables, lists, badges, tags, charts
Navigation
Headers, side navigation, breadcrumbs, pagination
Foundations
Colours, text styles, spacing, radii, shadows, icons
Content
Button labels, error messages, dates, numbers
Step 3: Group the near-duplicates
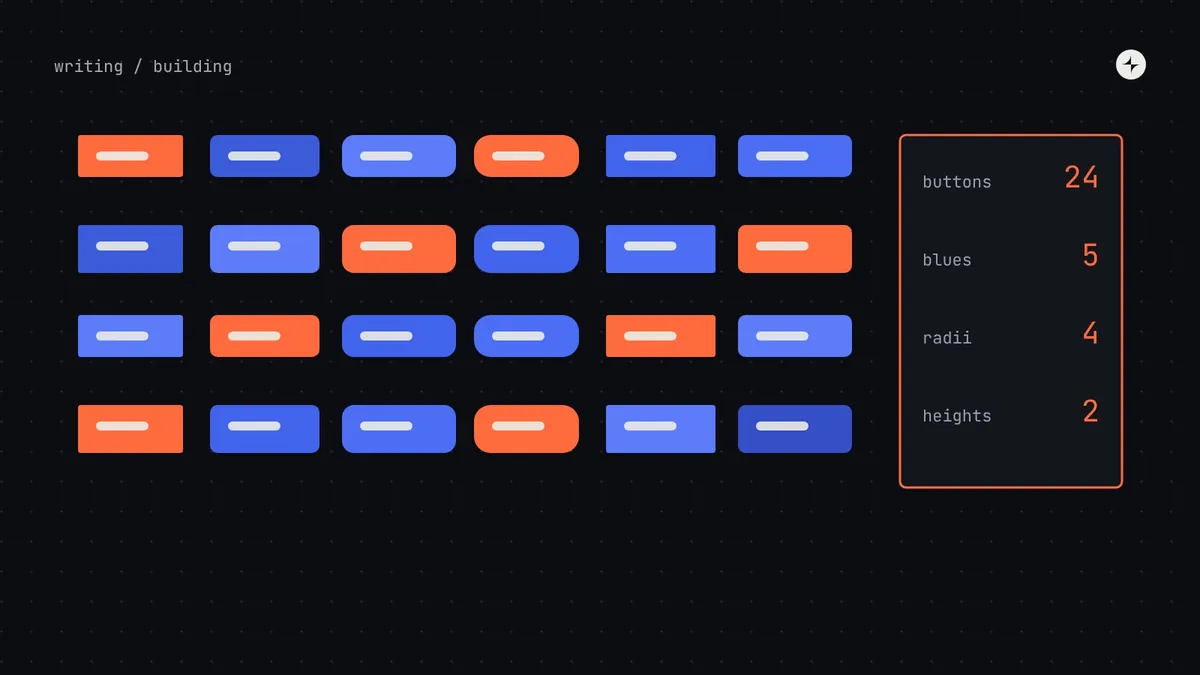
Within each board, put things that are meant to be the same next to each other. Five primary buttons with slightly different heights, radii and blues; four ways to show an error; three date pickers. Don't judge yet, just group. The visual comparison does the persuading for you.
Step 4: Count, in design and in code
This is the step most audits skip, and the one that makes yours useful. For each category, record:
- How many different versions exist in production.
- How many implementations exist in code: separate button components, separate modal components, copy-pasted variants.
- How many raw values are in the code: search the repositories for hex codes,
rgb()values and pixel sizes typed directly into styles. - How often each component is used: count imports or instances in code and in design files.
# Rough but useful: distinct hex colours in the front-end code
grep -rhoiE '#[0-9a-f]{6}\b|#[0-9a-f]{3}\b' src/ | tr 'A-F' 'a-f' | sort | uniq -c | sort -rn | head -40

# How many different button components exist?
grep -rlE '(export (default )?function|const) \w*Button\b' src/ | wc -l
These counts are imperfect, and that's fine. You're looking for orders of magnitude: "eleven border greys" and "four modal implementations" are what leadership remembers.
Step 5: Check accessibility and foundations
Run an automated checker on each screen in scope and record the issues by type. Then check the foundations directly:
- Text and background pairs meet WCAG 2.2 contrast: 4.5:1 for body text, 3:1 for large text, borders and focus indicators.
- Every interactive element shows a visible focus state and can be reached with a keyboard.
- Form fields have visible labels, and errors say what went wrong and how to fix it.
- Touch targets are at least 24 by 24 CSS pixels (WCAG 2.2, 2.5.8), and ideally 44 or more on mobile.
- Text still works when users enlarge it to 200% and increase line and letter spacing.
Accessibility issues found in shared-looking components are the strongest argument for a design system: fix them once in the system, and they're fixed everywhere it's used. WebAIM's 2025 scan found low-contrast text on 79.1% of the top million home pages, so expect to find some.
Step 6: Rank what to fix first
Now combine two pieces of information for each component: how often it's used, and how much trouble it causes (versions, bugs, accessibility issues, time spent rebuilding or debating it).
Step 7: Share it, in person
Walk leadership and product teams through the boards. Don't send a PDF. Seeing seven primary buttons on one wall is the fastest way to build shared understanding, and it's when people start asking "so what do we do?", which is exactly the question you want.
What a good audit report contains
Keep it short. The boards do the persuading; the report records the decisions.
Five or six headline counts: button versions, raw colour values, modal implementations, accessibility issues by severity, text styles in use.
One image per category showing the near-duplicates side by side.
Every component plotted on the 2×2, with the first ten to build named.
What to do in the next 90 days: foundations, first components, pilot team, owner. With rough effort in FTE-weeks.
Example headline numbers from a fictional audit. Illustration Your numbers will differ; their shape usually won't.
Turning the audit into a business case
Counts become a business case when you connect them to time and risk. Three simple translations work well:
Duplication → maintenance cost
Four modal implementations means four places to fix every bug and four to update in a rebrand. Ask engineers how long the last cross-cutting change took.
Accessibility issues → risk
If you sell to enterprises or the public sector, or operate in the EU under the European Accessibility Act, issues in shared components are a compliance exposure, not just a quality problem.
Raw values → change cost
Hundreds of hard-coded colours means a rebrand or dark mode is a rewrite. Tokens turn it into a configuration change. See design tokens.
Be careful with speed claims. Published studies show real gains on specific tasks, but they're best cases. We've written an honest model, with break-even points by team size, in design system ROI.
Common audit mistakes
Auditing only Figma
Design files show intentions. Production and code show reality. The gap between them is often the most important finding.
Auditing every screen
You'll spend weeks and learn little more than you would from 20 well-chosen screens.
Doing it alone
A solo audit produces a report people feel judged by. A team audit produces supporters.
Stopping at the inventory
Boards without a ranking and a 90-day plan are interesting, not useful. Always end with what to build first.
The short version
- Scope 15–25 key screens; capture every element by category; group near-duplicates.
- Count in code as well as design: versions, implementations, raw values, usage.
- Check accessibility and foundations; issues in shared components are the strongest case for a system.
- Rank by frequency × trouble; build the top-right components first.
- Share it in person, as a team, and end with a 90-day plan.
Frequently asked questions
How long does a UI audit take?
About two weeks for most product companies with one to three products, with one or two designers and an engineer. A single-product startup can do a lighter version in a few days.
Who should be involved?
Designers and engineers together, with product leads joining for the walkthrough. Engineers are essential for the code counts, which are often the most revealing numbers.
Can a design system audit be automated?
Parts of it. Code searches for raw values, import counts, Figma library analytics and automated accessibility checkers all help. Grouping near-duplicates and ranking them still needs people.
What's the difference between a UX audit and a UI audit?
A UX audit looks at whether people can complete their tasks: flows, findability, friction. A UI or design system audit looks at what the interface is made of and how consistent it is. They complement each other.
How often should we audit?
A full audit before starting or restarting a system, then a lighter check every quarter: raw values, detached components and new one-off patterns.
Further reading
- Interface InventoryBrad Frost. The original method.
- WCAG 2.2W3C. The accessibility standard to check against.
- The WebAIM Million, 2025WebAIM. What the most common accessibility failures are.
- CARS24: one design system for 30+ internal toolsA system that started with an audit of 20+ tools.