
The short answer
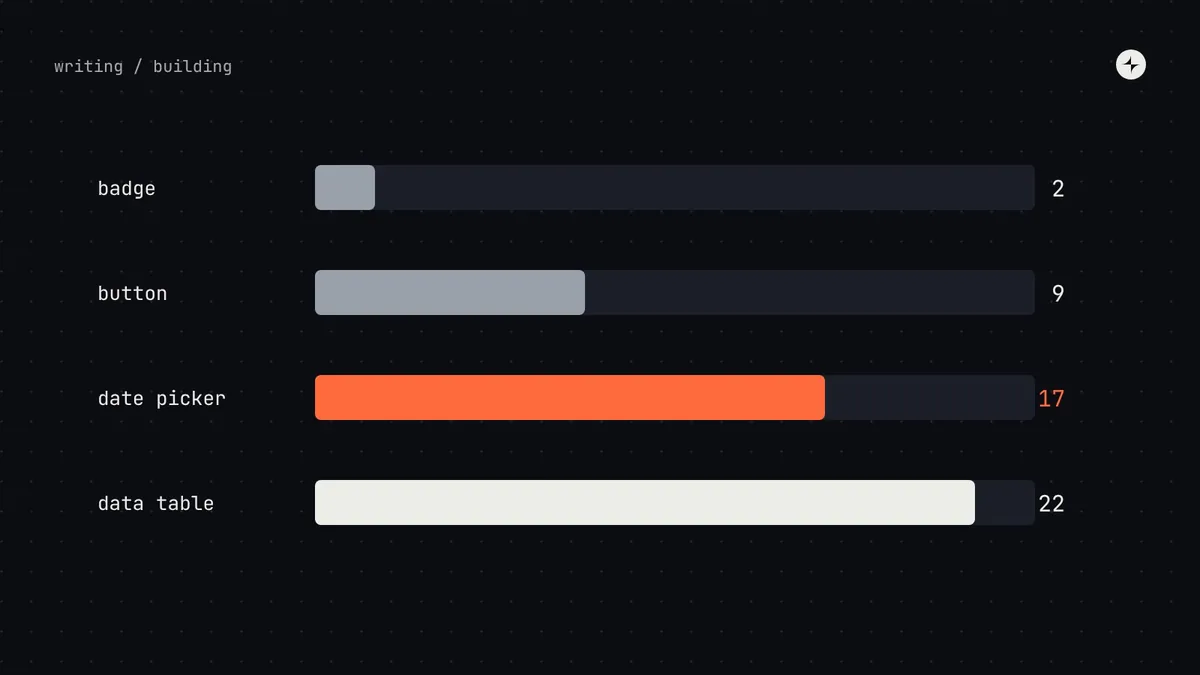
Not all components are equal: a badge takes days, a data table can take months. Sort components into four levels: elements (show something), controls (one clear interaction), composites (several parts that coordinate) and systems (data, logic and performance). For planning, score each one 0–3 on eight questions (options, states, interaction, keyboard and screen reader, data, screen sizes, composition, platforms) and add them up. Then match the process (people, research, testing, beta length) to the level, and plan by points rather than by component count.
- 0–6 points is level 1, 7–12 level 2, 13–18 level 3, 19–24 level 4.
- A date picker scores like a composite, not a select menu: dates are data, and the calendar grid has demanding keyboard behaviour.
- Each extra platform adds roughly the same effort again.
Why "ten components this quarter" misleads
Plans that count components treat a divider and a data table as the same unit of work. They're not, and the result is predictable: the quarter's plan looks on track until the one complex component swallows two months. Leadership loses confidence, and the team gets blamed for a planning model that was wrong from the start.
Complexity also matters for process. Running a heavyweight process for a badge wastes everyone's time; running a lightweight one for a data table guarantees bugs in production.
Four levels of complexity
These loosely echo Brad Frost's idea of building from small parts to large ones, but they're organised by how hard something is to get right, not by how big it is.
Level 3 is where accessibility gets genuinely hard: a menu has a trigger and a list, tabs have a tab list and panels, a dialog manages focus for everything inside it, and people expect established keyboard patterns. Level 4 components are small applications in their own right and often take longer than everything else in the library combined.
Scoring complexity: eight questions
Levels are a good first guess. For planning, rate each component 0–3 on eight questions and add them up. You don't need precision; the point is to have the conversation as a team before committing to dates.
| Question | 0 · none | 1 · a little | 2 · quite a lot | 3 · a lot |
|---|---|---|---|---|
| Options | One version | 2–3 variants | Variants × sizes | Many combinations |
| States | Static | Hover, focus | Full interactive set | Plus loading, empty, error |
| Interaction | None | Click | Typing, selection | Drag, resize, multi-select |
| Keyboard & screen reader | Nothing special | Tab and Enter | Arrow keys, announcements | Complex focus, live updates |
| Data | None | A simple value | Lists, formatting | Large data, async loading |
| Screen sizes | Same everywhere | Minor adjustments | Different layout on mobile | Different behaviour on mobile |
| Composition | Single part | Fixed sub-parts | Slots or children | Nested, coordinated components |
| Platforms | Web only | Web, one framework | Web plus one native | Web, iOS and Android |
Four components, scored
| Component | Opt. | States | Inter. | Keys | Data | Screens | Comp. | Plat. | Total | Level |
|---|---|---|---|---|---|---|---|---|---|---|
| Badge | 1 | 0 | 0 | 0 | 0 | 0 | 0 | 1 | 2 | 1 · Element |
| Button | 2 | 2 | 1 | 1 | 0 | 1 | 1 | 1 | 9 | 2 · Control |
| Date picker | 2 | 3 | 2 | 3 | 2 | 2 | 2 | 1 | 17 | 3 · Composite |
| Data table | 3 | 3 | 3 | 3 | 3 | 3 | 3 | 1 | 22 | 4 · System |
Match the process to the level
| 1 · Elements | 2 · Controls | 3 · Composites | 4 · Systems | |
|---|---|---|---|---|
| Who's involved | One designer, one engineer | Pair, plus an accessibility check | Pair, accessibility specialist, a pilot team | A small squad, several pilots, product managers |
| Research | Inventory only | Inventory and real content | Usage research across teams | Requirements gathering, like a product feature |
| Accessibility | Contrast, labels | Keyboard and screen reader basics | Full ARIA pattern; manual testing | Expert review; testing with assistive technology users |
| Testing | Visual | Visual and behaviour | Plus manual keyboard and screen reader | Plus performance with real data volumes |
| Beta period | None | A week or two | A month, with a pilot | A quarter, with several pilots |
| Documentation | Short page | Full template | Template plus behaviour notes | Guides, recipes and examples |
| Typical effort | Days | 1–2 weeks | 3–6 weeks | 1–3 months or more |
For level 3 and 4 components, start with a kick-off workshop with every team that will use the component: walk through every existing version, agree must-haves and out-of-scope items, and name the pilot team. People support what they helped shape.
Plan by points, not by count
Instead of "ten components this quarter", plan with the totals: "about 90 points this quarter". A badge is 2 points; a data table is 22. It sounds a little nerdy, but it makes plans honest overnight, and it gives leadership a much better picture of progress than a count of finished components.
The same scores help with request prioritisation: complexity is the "effort" that divides a request's value score.
Choose the simplest component that works
Complexity is also a design decision for product teams. Every time a designer picks a component, they pick a level of complexity for users and for the engineers who'll build the screen. The simplest component that does the job is almost always right.
| If people need to… | Prefer | Over | Unless… |
|---|---|---|---|
| Choose one of 2–5 options | Radio buttons | A dropdown select | Space is very tight |
| Choose one of 6–15 options | A select | A searchable combobox | Options are unfamiliar or long |
| Choose from hundreds of options | A combobox with search | A custom picker dialog | Options need images or grouping |
| Enter a date they know (a birthday) | Simple text fields | A calendar date picker | They need to see days of the week |
| Show extra information | Text on the page | A tooltip | It's genuinely secondary |
The short version
- Four levels: elements, controls, composites, systems.
- Score components 0–3 on eight questions to place them and estimate effort.
- Match people, research, testing and beta length to the level.
- Plan by points, not by number of components.
- For product teams: choose the simplest component that does the job.
Frequently asked questions
How long does it take to build a design system component?
From days for a simple element to one to three months or more for a data table, on one platform. Score the component to estimate it.
Why are date pickers so hard?
Because they combine data (locales, time zones, ranges, disabled days) with a calendar grid that needs complex keyboard and screen reader behaviour.
Should the whole team score components together?
Yes, briefly. The value is in the conversation: designers, engineers and accessibility specialists notice different sources of complexity.
How do we re-score as we learn more?
Re-score yearly, or when a component's scope changes. Scores also help explain to leadership why one component took a quarter.
Further reading
- Atomic DesignBrad Frost. Building from small parts to large ones.
- ARIA Authoring Practices GuideW3C. Why composites are hard.
- Which components to build firstThe prioritisation method.